Tired of spending more than 50% of your time building graphs and reports?
Building graphs and reports can be a monotonous and tedious job. It takes up numerous hours per day, and your other responsibilities keep piling up. Supplier change requests, process qualifications, process validations, and capability analyses all continue to accumulate.
You need a new and tested productivity tool that can save you time to focus on more critical tasks. Use the new PQ-it macro developed for Minitab statistical software. It reduces the time spent in statistical evaluations for production capabilities of single/multiple parts with single/multiple features.
The gift of time
By using the PQ-it macro, you can complete your analysis more than five times faster than with manual construction. The average time saved on analyzing one 100-feature part vs. manual analysis is 5 hours. Even a simple 5-feature product analysis can save you at least 15 minutes.
Save up to 5 hours on a single product

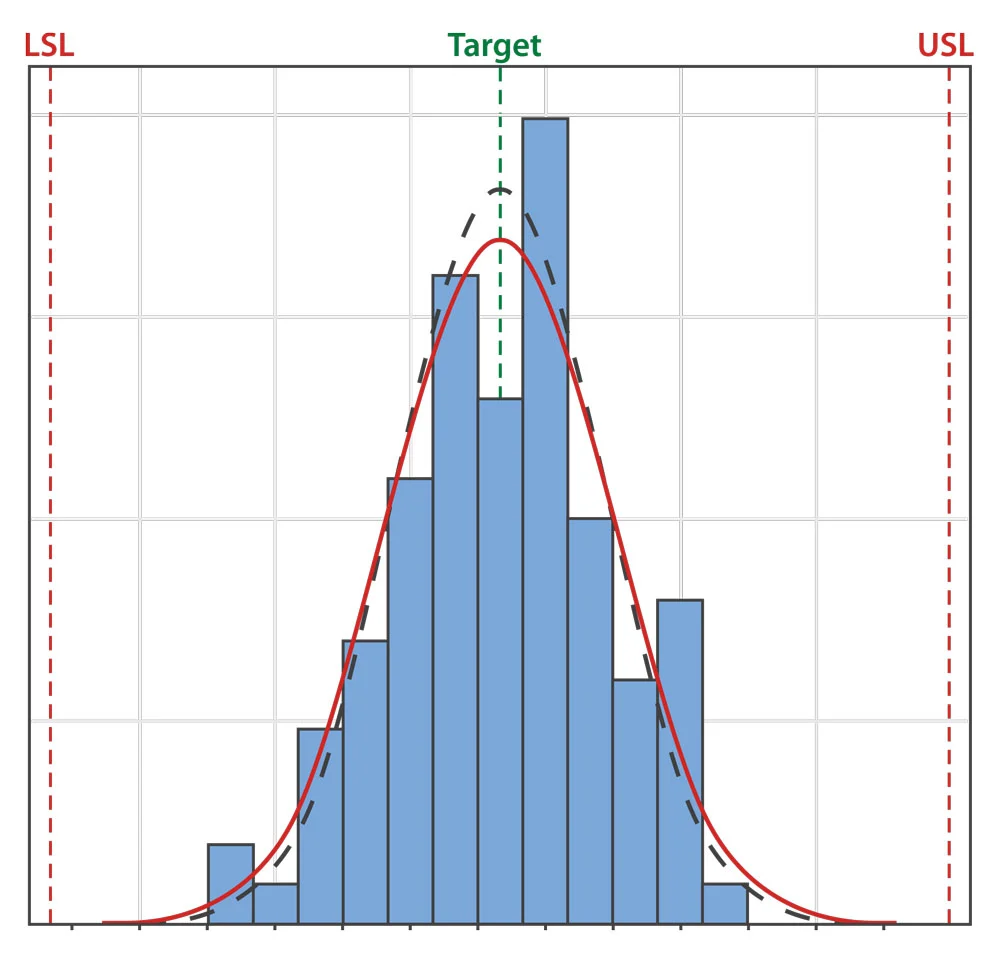
PQ-it output data
After the analysis is complete, the PQ-it™ macro generates the following outputs:
The summary table reports the following values:
The PQ-it™ macro was developed by Lowell, Inc., a precision machining contract manufacturer based in Minneapolis, Minnesota. Founded in 1964, Lowell, Inc. is a leading contract manufacturer of implantable medical devices and instruments for the Orthopaedic and Cardiovascular markets.


Our quality assurance program combines data-driven manufacturing and validation, advanced technology and staff expertise.

Lowell makes ongoing investments in technology to manufacture and test your finished components and assemblies.

Our proven manufacturing process helps improve time to market through profile tolerancing, GD&T, critical feature confirmation and design intent.

At Lowell, everything starts with our people — experienced, trained, professional, precise.
The opportunities that Lowell offers are not found in other machine shops. There is versatility within the inspection, mill, lathe and swiss departments. As a newly graduated student from Hennepin Tech I was able to work in each department. The cell managers are willing to teach me more so I can grow with the company and make a great career.